How to configure Appflow and syslogs on netscaler
04 June, 2018
Hi Citrix Admin
Here is good link for how to configure Syslog and Appflow.
https://www.youtube.com/watch?v=ZRfVBEjocSM
Thanks
Amit Gupta

Hello world!

Hi Citrix Admin
Here is good link for how to configure Syslog and Appflow.
https://www.youtube.com/watch?v=ZRfVBEjocSM
Thanks
Amit Gupta
Hi Cloud Admins
Here are some examples for Creating kubernetes cluster in Kubernetes Engine.
1. Confirm that needed APIs are enabled
Make a note of the name of your GCP project.
In the GCP Console, on the Products & Services () menu, click APIs & services.
Scroll down in the list of enabled APIs, and confirm that both of these APIs are enabled:
Google Kubernetes Engine API
Google Container Registry API
If either API is missing, click Enable APIs and Services at the top. Search for the above APIs by name and enable each for your current project. (You noted the name of your GCP project above.)
Start a Kubernetes Engine cluster
On the Google Cloud Platform menu, click Activate Google Cloud Shell (). If a dialog box appears, click Start Cloud Shell.
At the Cloud Shell prompt, type this partial command:
export MY_ZONE=
followed by the zone that Qwiklabs assigned you to. Your complete command will look like this:
export arvgroup_ZONE=us-central1-a
Start a Kubernetes cluster managed by Kubernetes Engine. Name the cluster webfrontend and configure it to run 2 nodes:
gcloud container clusters create webfrontend --zone $arvgroup_ZONE --num-nodes 2
After the cluster is created, check your installed version of Kubernetes using the kubectl version command:
kubectl version
The gcloud container clusters create command automatically authenticated kubectl for you.
View your running nodes in the GCP Console. On the Products & Services menu, click Compute Engine > VM Instances.
Your Kubernetes cluster is now ready for use.
Run and deploy a container
From your Cloud Shell prompt, launch a single instance of the nginx container. (Nginx is a popular web server.)
kubectl run nginx --image=nginx:1.10.0
In Kubernetes, all containers run in pods. This use of the kubectl run command caused Kubernetes to create a deployment consisting of a single pod containing the nginx container. A Kubernetes deployment keeps a given number of pods up and running even in the event of failures among the nodes on which they run. In this command, you launched the default number of pods, which is 1.
View the pod running the nginx container:
kubectl get pods
Expose the nginx container outside Kubernetes:
kubectl expose deployment nginx --port 80 --type LoadBalancer
Kubernetes created a service and an external load balancer with a public IP address attached to it. The IP address remains the same for the life of the service. Any network traffic to that public IP address is routed to pods behind the service: in this case, the nginx pod.
View the new service:
kubectl get services
You can use the displayed external IP address to test and contact the nginx container remotely.
It may take a few seconds before the ExternalIP field is populated for your service. This is normal. Just re-run the kubectl get services command every few seconds until the field is populated.
Open a new web browser tab and paste your cluster's external IP address into the address bar. The default home page of the Nginx browser is displayed.
Scale up the number of pods running on your service:
kubectl scale deployment nginx --replicas 4
Scaling up a deployment is useful when you want to increase available resources for an application that is becoming more popular.
Confirm that Kubernetes has updated the number of pods:
kubectl get pods
Confirm that your external IP address has not changed:
kubectl get services
Return to the web browser tab in which you viewed your cluster's external IP address. Refresh the page to confirm that the nginx web server is still responding.
Great , we are done
Thanks
Amit Gupta
https://www.linkedin.com/in/amit-kumar-gupta-5321a527/
Hi Citrix Admins
Here are well tested code to migrate the XenDesktop Database from One SQL Server to Another Server.
1. Fetch the Current Application config
## Load the Citrix snap-ins
asnp Citrix.*
## ## Get the current Delivery Controller database connections
Get-ConfigDBConnection
Get-AcctDBConnection
Get-AnalyticsDBConnection # 7.6 and newer
Get-AppLibDBConnection # 7.8 and newer
Get-OrchDBConnection # 7.11 and newer
Get-TrustDBConnection # 7.11 and newer
Get-HypDBConnection
Get-ProvDBConnection
Get-BrokerDBConnection
Get-EnvTestDBConnection
Get-SfDBConnection
Get-MonitorDBConnection
Get-MonitorDBConnection -DataStore Monitor
Get-LogDBConnection
Get-LogDBConnection -DataStore Logging
Get-AdminDBConnection
2. Set Database value to Null.
Disable configuration logging for the XD site:
Set-LogSite -State Disabled
Set-ConfigDBConnection -DBConnection $null
Set-AcctDBConnection -DBConnection $null
Set-AnalyticsDBConnection -DBConnection $null # 7.6 and newer
Set-AppLibDBConnection -DBConnection $null # 7.8 and newer
Set-OrchDBConnection -DBConnection $null # 7.11 and newer
Set-TrustDBConnection -DBConnection $null # 7.11 and newer
Set-HypDBConnection -DBConnection $null
Set-ProvDBConnection -DBConnection $null
Set-BrokerDBConnection -DBConnection $null
Set-EnvTestDBConnection -DBConnection $null
Set-SfDBConnection -DBConnection $null
Set-MonitorDBConnection -DataStore Monitor -DBConnection $null
Set-MonitorDBConnection -DBConnection $null
Set-LogDBConnection -DataStore Logging -DBConnection $null
Set-LogDBConnection -DBConnection $null
Set-AdminDBConnection -DBConnection $null -force
3. Restart the XenDesktop Services.
Get-Service Citrix* | Stop-Service -Force
Get-Service Citrix* | Start-Service
4. Fetch the SQL configuration once values are set to NULL.
Get-ConfigDBConnection
Get-AcctDBConnection
Get-AnalyticsDBConnection # 7.6 and newer
Get-AppLibDBConnection # 7.8 and newer
Get-OrchDBConnection # 7.11 and newer
Get-TrustDBConnection # 7.11 and newer
Get-HypDBConnection
Get-ProvDBConnection
Get-BrokerDBConnection
Get-EnvTestDBConnection
Get-SfDBConnection
Get-MonitorDBConnection
Get-LogDBConnection
Get-AdminDBConnection
5. Insert new SQL DB values in system.
$ServerName = "xxxxx"
$SiteDBName = "xxxxx"
$LogDBName = "xxxxx"
$MonitorDBName = "xxxxx"
$csSite = "Server=$ServerName;Initial Catalog=$SiteDBName;Integrated Security=True"
$csLogging = "Server=$ServerName;Initial Catalog=$LogDBName;Integrated Security=True"
$csMonitoring = "Server=$ServerName;Initial Catalog=$MonitorDBName;Integrated Security=True"
Set-AdminDBConnection -DBConnection $csSite
Set-ConfigDBConnection -DBConnection $csSite
Set-AcctDBConnection -DBConnection $csSite
Set-AnalyticsDBConnection -DBConnection $csSite # 7.6 and newer
Set-HypDBConnection -DBConnection $csSite
Set-ProvDBConnection -DBConnection $csSite
Set-AppLibDBConnection –DBConnection $csSite # 7.8 and newer
Set-OrchDBConnection –DBConnection $csSite # 7.11 and newer
Set-TrustDBConnection –DBConnection $csSite # 7.11 and newer
Set-BrokerDBConnection -DBConnection $csSite
Set-EnvTestDBConnection -DBConnection $csSite
Set-SfDBConnection -DBConnection $csSite
Set-LogDBConnection -DBConnection $csSite
Set-LogDBConnection -DataStore Logging -DBConnection $null
Set-LogDBConnection -DBConnection $null
Set-LogDBConnection -DBConnection $csSite
Set-LogDBConnection -DataStore Logging -DBConnection $csLogging
Set-MonitorDBConnection -DBConnection $csSite
Set-MonitorDBConnection -DataStore Monitor -DBConnection $null
Set-MonitorDBConnection -DBConnection $null
Set-MonitorDBConnection -DBConnection $csSite
Set-MonitorDBConnection -DataStore Monitor -DBConnection $csMonitoring
6. Test the connection string.
$ServerName = "xxxxx"
$SiteDBName = "xxxxx"
$LogDBName = "xxxxx"
$MonitorDBName = "xxxxx"
$csSite = "Server=$ServerName;Initial Catalog=$SiteDBName;Integrated Security=True"
$csLogging = "Server=$ServerName;Initial Catalog=$LogDBName;Integrated Security=True"
$csMonitoring = "Server=$ServerName;Initial Catalog=$MonitorDBName;Integrated Security=True"
Test-AcctDBConnection -DBConnection $csSite
Test-AdminDBConnection -DBConnection $csSite
Test-AnalyticsDBConnection -DBConnection $csSite # 7.6 and newer
Test-AppLibDBConnection -DBConnection $csSite # 7.8 and newer
Test-BrokerDBConnection -DBConnection $csSite
Test-ConfigDBConnection -DBConnection $csSite
Test-EnvTestDBConnection -DBConnection $csSite
Test-HypDBConnection -DBConnection $csSite
Test-LogDBConnection -DBConnection $csSite
Test-LogDBConnection -DataStore Logging -DBConnection $csLogging
Test-MonitorDBConnection -DBConnection $csSite
Test-MonitorDBConnection -Datastore Monitor -DBConnection $csMonitoring
Test-OrchDBConnection -DBConnection $csSite # 7.11 and newer
Test-ProvDBConnection -DBConnection $csSite
Test-SfDBConnection -DBConnection $csSite
Test-TrustDBConnection -DBConnection $csSite # 7.11 and newer
7. Restart studio.
All Done and things should work fine.
Thanks
Amit Kumar Gupta
https://www.linkedin.com/in/amit-kumar-gupta-5321a527/
Hi Citrix Admins
Here is some useful information on how to generate Citrix license usage report when edgesight is no more.
this is possible with 7.12 version above via desktop director indirect reports.
Peak concurrent Session (so alerts will intimate whenever thresholds are met)
or you can run Custom queries for same.
Other ways to get these report via Citrix blogs.
https://docs.citrix.com/en-us/licensing/11-14/citrix-licensing-manager/export-usage-data.html
Obviously, there are many scripts can be used to achieve same.
Thanks
Amit Gupta
https://www.linkedin.com/in/amit-kumar-gupta-5321a527/
Hi Citrix Admins
you might face random issues while post upgrading the VDA from 7.6 to 7.15 CU1 .
Many of the desktops will give Blank screen at Hypervisor console & ICA session.
RDP will work with fine.
This is something recently experienced BUG with 7.15 CU1 VDA and get fixed by implementing CU2 update for VDA.
the solution can vary on the basis on Environment and client OS. we have faced this issue with Windows 10 Client OS and worked fine with CU2.
if you are interested in participating in Blogs as Technical Geeks then write to us at ARVGroupServices@gmail.com
Also visit: http://www.ittechyminds.com/index.php?controller=post&action=view&id_post=11
Thanks
Amit Gupta
https://www.linkedin.com/in/amit-kumar-gupta-5321a527/
Hi Citrix Admins
There are many existing features introduced with XenDesktop 7.15. we will cover Desktop Director in this Section for how to enable monitoring and alert notification for XenDesktop environment which is missing in 7.6.
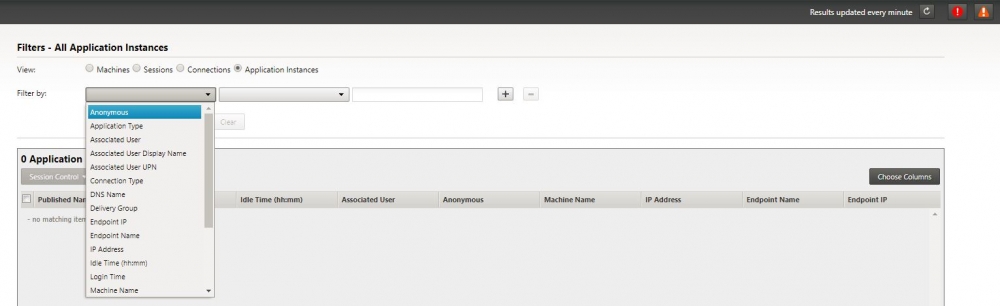
1. new reporting option in console - application base reports
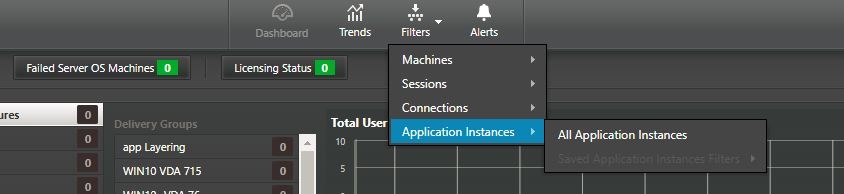
2. Select the kind of report you want to generate for applcation section.
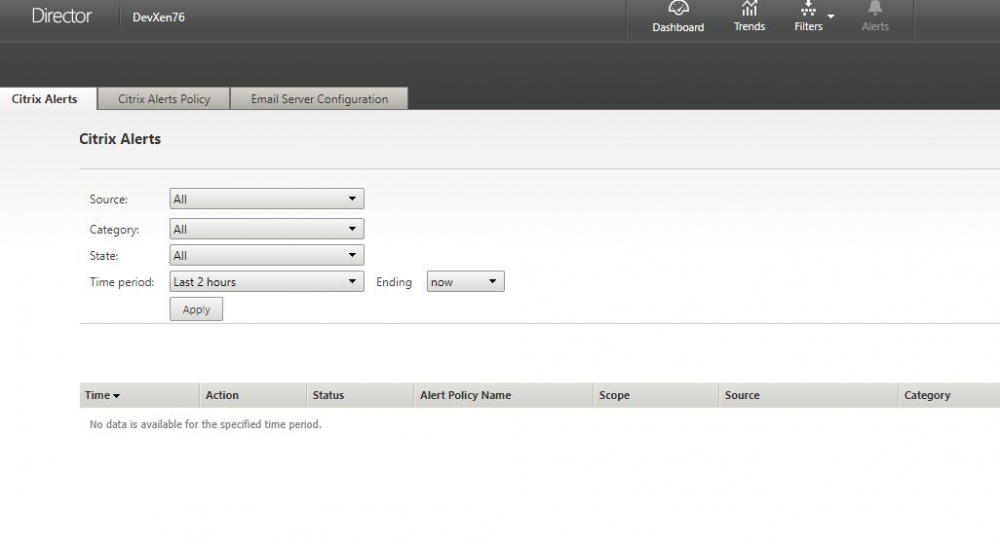
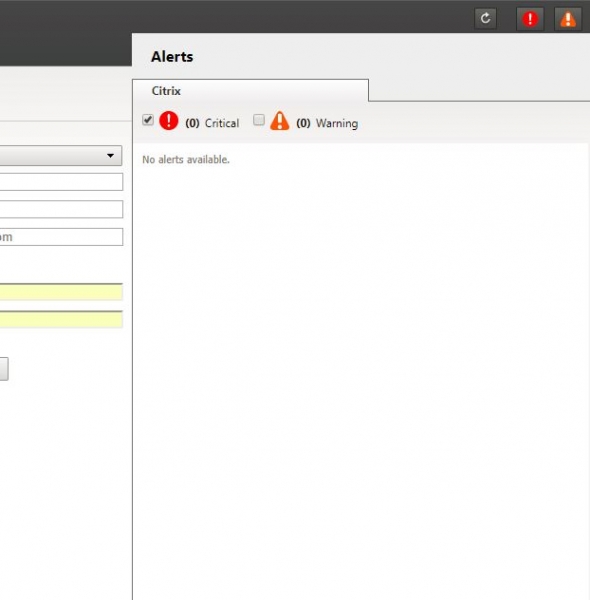
3. Consolidated view of all the kind of Citrix alerts.
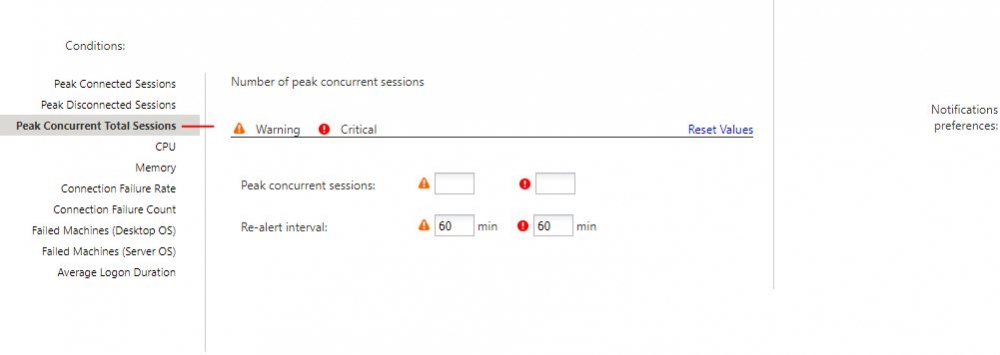
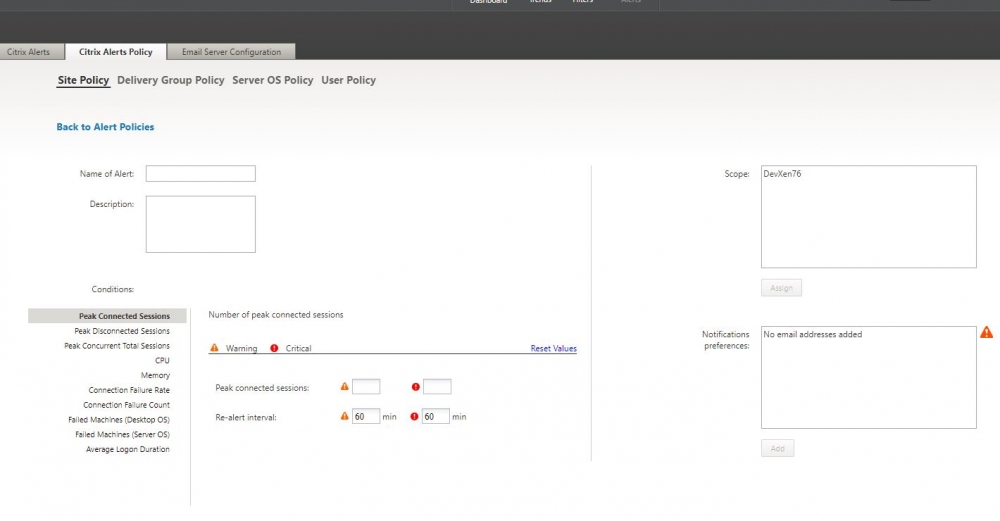
4. Configure Alerts for Site and thresholds
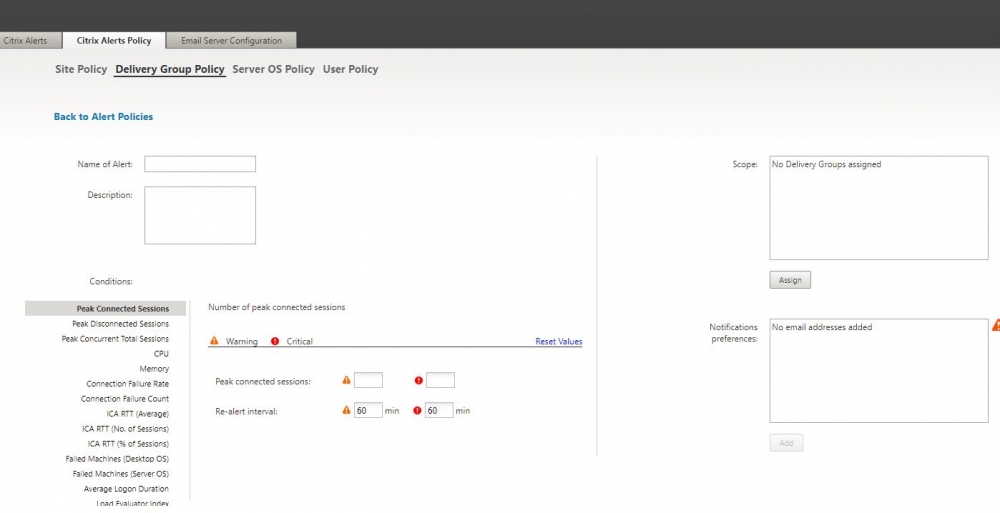
5. Configure alert notification for Delivery groups and thresholds.
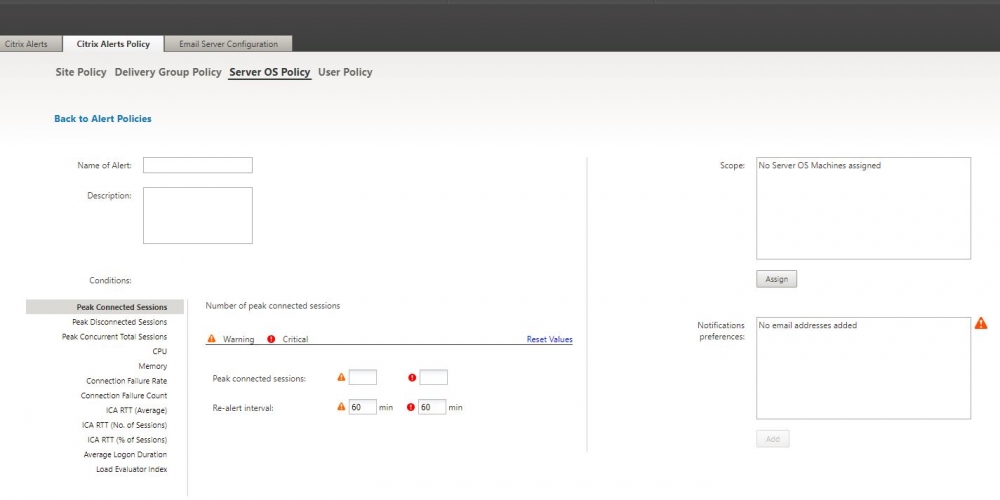
6. Configure Server based Alerts and thresholds.
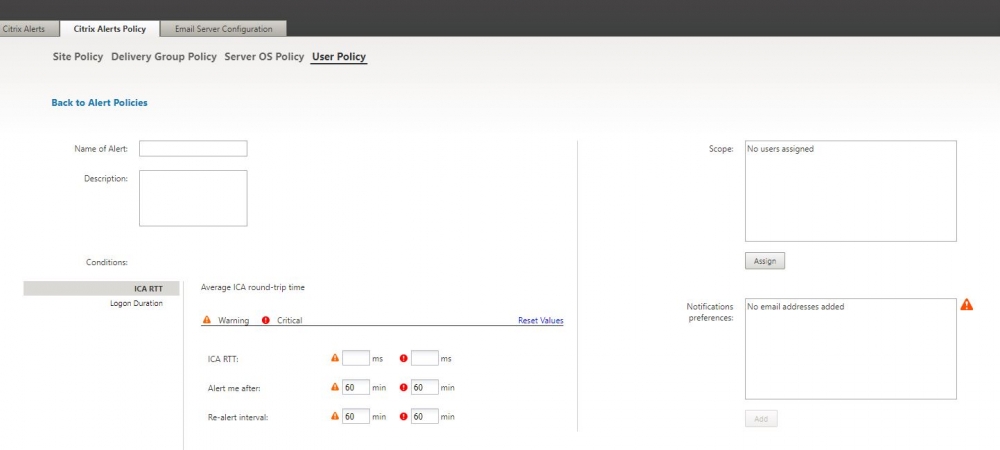
7. Configure User base alerts and thresholds.
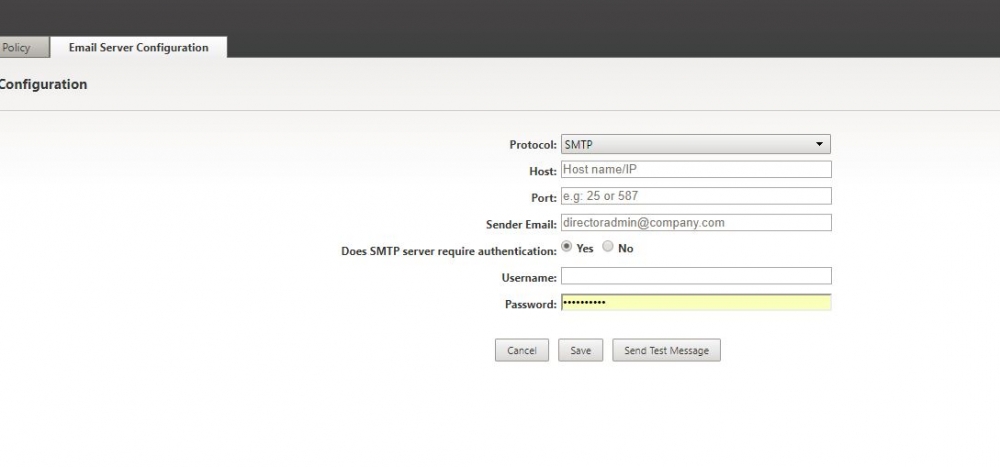
8. SMTP relay configuration for sending the alerts
9. Quick view option for Critical and warning in site.
Soon we would be release deep techy video for XD 7.17 and 7.15 internal parts. keep visiting site.
Thanks
Amit Gupta